

Ontario Wheat Quality
Ontario is situated between the Great Lakes and the St. Lawrence River Basin, with a temperate climate and fertile soils that are key components to producing top-quality winter and spring wheat.
Ontario Wheat Production
Ontario’s size and varied geography enable farmers to grow several wheat varieties, from soft wheat in the southwest to hard wheat in the east. Ontario’s wheat production is supported by its proximity to strong transportation infrastructure (highways, rail lines, and river access to ocean ports) and an ample supply of energy sources.
Ontario’s Annual Wheat Harvest Survey
Grain Farmers of Ontario’s annual wheat harvest survey program is delivered in partnership with SGS Canada, which provides in-season grain quality testing services and Cereals Canada, which conducts milling and baking quality testing services.
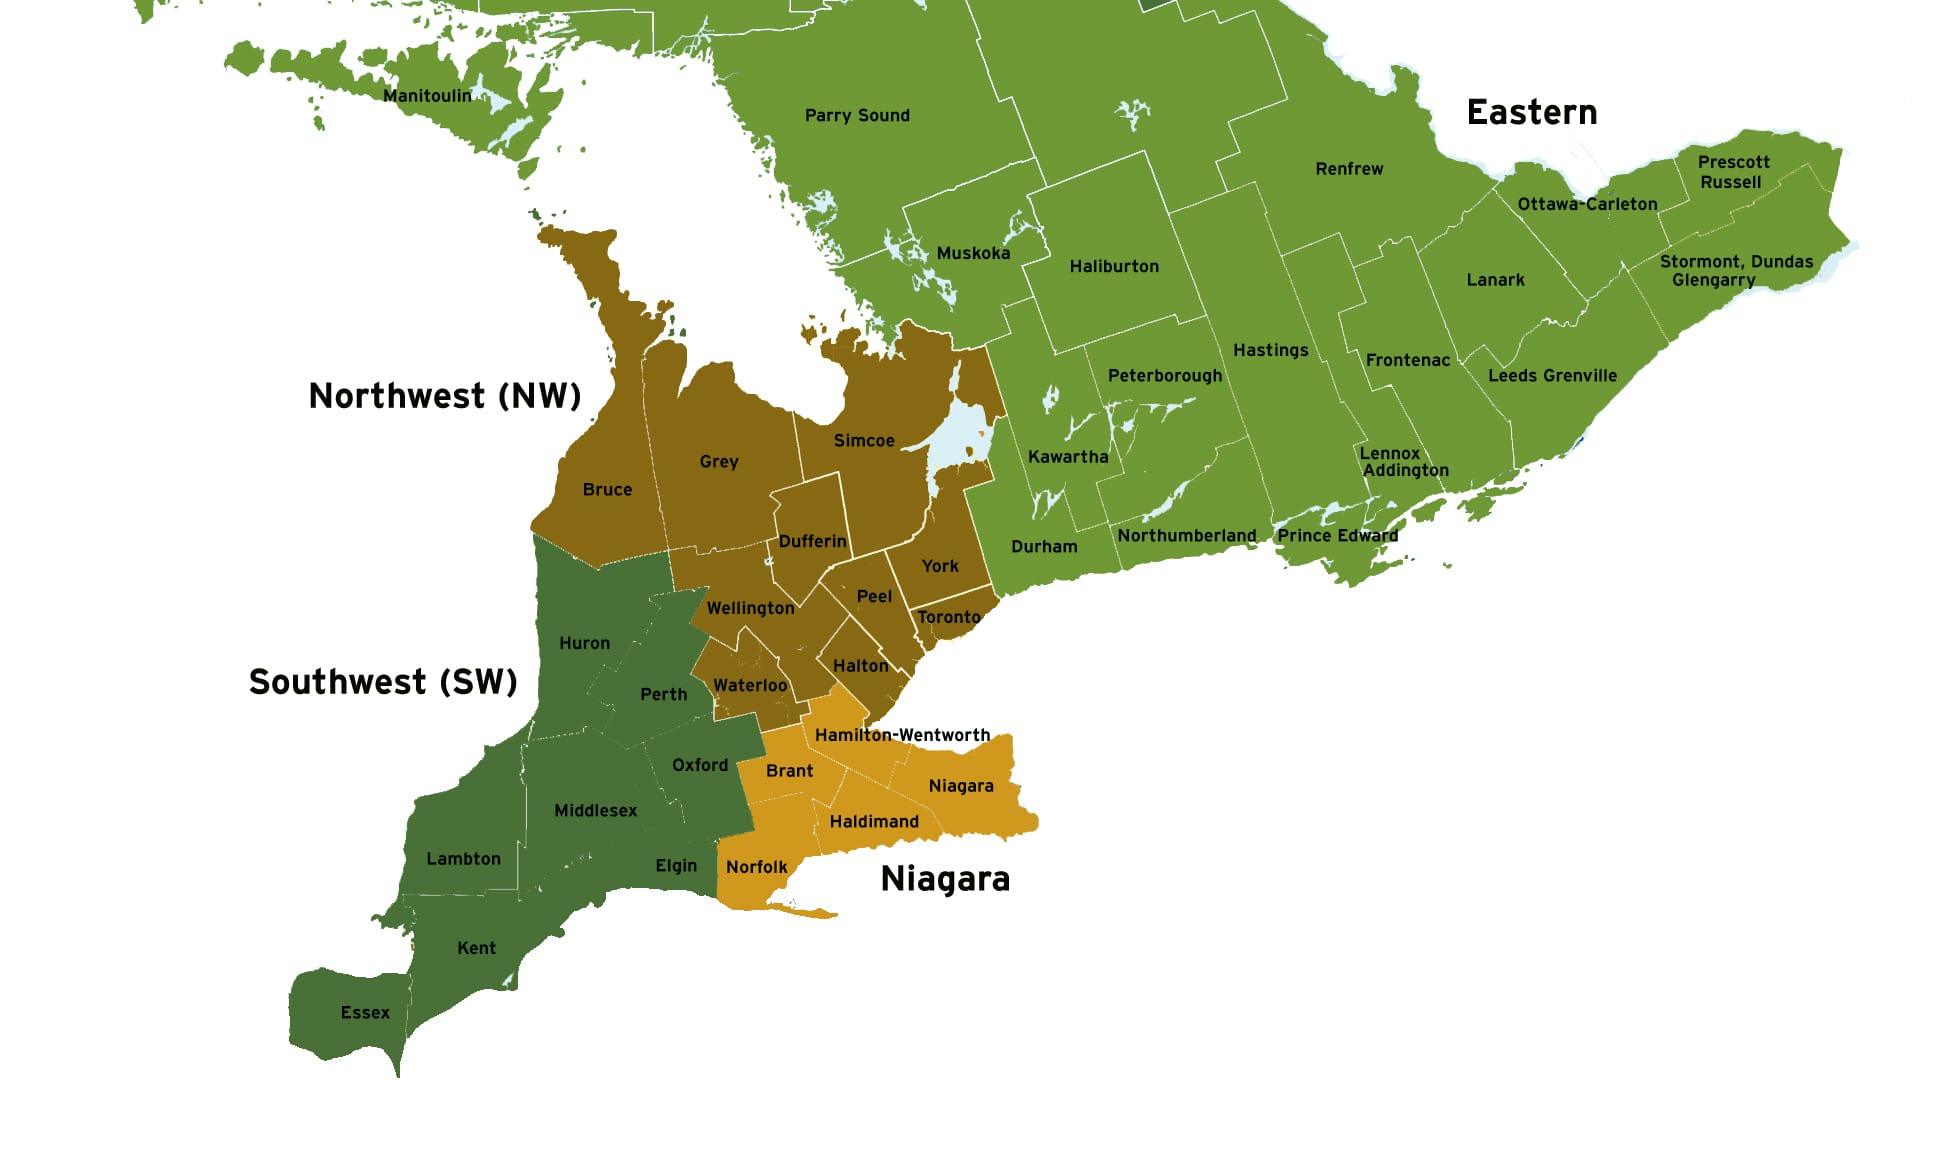
Wheat samples are collected annually from across Ontario to provide farmers and the grain supply chain, including wheat millers, with an average representation of wheat quality in Ontario and each sub-region (see map below). The program collects representative samples from each region to accurately reflect production systems and wheat classes grown.
The results produced in this sampling program indicate average wheat quality across Ontario and its sub-regions and are not intended to serve as definitive quality values for individual fields or truckloads. Grain Farmers of Ontario works with supply chain partners such as grain elevators across Ontario, who oversee the actual collection of the wheat samples. These samples are graded on a weekly basis by SGS labs and then sent to Cereals Canada for composite milling and baking quality testing.
Each group of submitted samples are posted online approximately 14 days after the harvest date.
Managing Quality on the Farm
Grain Farmers of Ontario strongly encourages farmers to seek independent testing on their own samples prior to delivery to indicate quality. Farmers should ensure the sample is representative of the field or the bin. Independent testing for grain grade, falling number, and vomitoxin are available through both private testing labs and the Canadian Grain Commission’s Harvest Sample Program. Visit Grain Farmers of Ontario’s Marketing page for dispute resolution resources such as the Code of Practice and Grain Contracts Guide.
2025 Wheat Technical Bulletins
Soft Red Winter
| Region* | Samples Collected | Protein (%) | Moisture (%) | Test Weight (kg/hL)** | Falling Number (sec) | Samples graded No.2 or better |
|---|---|---|---|---|---|---|
| South West | 111 | 9.0 | 14.0 | 77.6 | 350 | 111 |
| 17-Jul | 33 | 8.6 | 14.1 | 78.5 | 353 | 33 |
| 21-Jul | 4 | 8.8 | 13.5 | 78.7 | 349 | 4 |
| 30-Jul | 62 | 9.3 | 14.1 | 77.2 | 349 | 61 |
| 06-Aug | 7 | 9.3 | 13.5 | 76.5 | 342 | 7 |
| 13-Aug | 4 | 9.4 | 13.0 | 76.8 | 352 | 4 |
| Niagara | 75 | 9.5 | 13.8 | 78.7 | 354 | 71 |
| 21-Jul | 14 | 9.0 | 14.8 | 79.2 | 342 | 14 |
| 06-Aug | 5 | 9.1 | 13.5 | 79.1 | 350 | 5 |
| 13-Aug | 55 | 9.6 | 13.6 | 78.5 | 356 | 51 |
| Northwest | 46 | 9.6 | 13.6 | 79.1 | 339 | 44 |
| 30-Jul | 14 | 9.9 | 13.9 | 80.3 | 355 | 14 |
| 06-Aug | 3 | 9.4 | 13.4 | 79.8 | 369 | 3 |
| 13-Aug | 3 | 8.2 | 14.7 | 78.1 | 300 | 3 |
| 20-Aug | 7 | 10.5 | 13.1 | 78.4 | 341 | 5 |
| 02-Sep | 20 | 9.4 | 13.4 | 78.5 | 331 | 20 |
| East | 45 | 9.6 | 13.3 | 78.9 | 341 | 45 |
| 20-Aug | 45 | 9.6 | 13.3 | 78.9 | 341 | 45 |
*Region line shows up-to-date average, date refers to when samples were assessed
**Test Weight is adjusted to 13.5%
Soft White Winter
| Region* | Samples Collected | Protein (%) | Moisture (%) | Test Weight (kg/hL)** | Falling Number (sec) | Samples graded No.2 or better |
|---|---|---|---|---|---|---|
| Southwest | 15 | 10.0 | 15.3 | 77.0 | 341 | 15 |
| 30-Jul | 7 | 10.6 | 16.7 | 75.6 | 334 | 7 |
| 06-Aug | 1 | 10.3 | 14.2 | 74.0 | 231 | 1 |
| 02-Sep | 7 | 9.4 | 15.0 | 78.3 | 354 | 7 |
| Northwest | 5 | 10.0 | 13.9 | 77.9 | 353 | 5 |
| 30-Jul | 5 | 10.0 | 13.9 | 77.9 | 353 | 5 |
*Region line shows up-to-date average, date refers to when samples were assessed
Hard Red Winter
| Region* | Samples Collected | Protein (%) | Moisture (%) | Test Weight (kg/hL)** | Falling Number (sec) | Samples graded No.2 or better |
|---|---|---|---|---|---|---|
| Northwest | 2 | 11.6 | 12.4 | 80.9 | 370 | 2 |
| 20-Aug | 2 | 11.6 | 12.4 | 80.9 | 370 | 2 |
| East | 8 | 11.2 | 13.2 | 81.7 | 325 | 5 |
| 20-Aug | 8 | 11.2 | 13.2 | 81.7 | 325 | 5 |
*Region line shows up-to-date average, date refers to when samples were assessed
Hard Red Spring
| Region* | Samples Collected | Protein (%) | Moisture (%) | Test Weight (kg/hL)** | Falling Number (sec) | Samples graded No.2 or better |
|---|---|---|---|---|---|---|
| East | 5 | 12.8 | 12.7 | 82.2 | 336 | 5 |
| 20-Aug | 5 | 12.8 | 12.7 | 82.2 | 336 | 5 |
*Region line shows up-to-date average, date refers to when samples were assessed
2025 Wheat Technical Bulletins
Ontario Soft Red Winter Wheat Technical Bulletin
Ontario Hard Red Winter Wheat Technical Bulletin
Ontario Soft White Winter Wheat Technical Bulletin
Ontario Hard Red Spring Wheat Technical Bulletin
2024 Wheat Technical Bulletins
Ontario Soft Red Winter Wheat Technical Bulletin
Ontario Hard Red Winter Wheat Technical Bulletin
Ontario Soft White Winter Wheat Technical Bulletin
Ontario Hard Red Spring Wheat Technical Bulletin
Information on soy quality
For information on soybean quality, please visit soycanada.ca.