Assessing the impact of tillage on phosphorus (P) loss through tile lines in Ontario
Principal Investigator: Merrin Macrae
Research Institution: University of Waterloo
Objectives:
- Characterization of phosphorus (P) forms lost from the on-farm research sites from April 2013-March 2014, to add to previous work (done between February 2011 and August 31, 2012 at two of the sites, and from August 2011-August 2012 at the third site) and complete one full crop rotation.
- Continue the assessment of reduced management tillage (RMT) systems (e.g., rotational or modified no-till systems used in Ontario) and their impact on P losses and annual loadings to better identify management systems for mitigating P loss from agricultural lands.
- Contribute to an Ontario data base on best management practice (BMP) impacts on P losses.
Impacts:
- Results will aid in the identification and adoption of BMPs for mitigation of P loss from agricultural lands.
Scientific Summary:
Reduced tillage systems such as no-till lower production costs while potentially improving profitability and soil health by decreasing soil erosion and therefore soil P loss. Despite its reduction in sediment-bound P losses, no-till may increase losses of water soluble (dissolved) P by allowing P concentrations to become stratified in the soil profile (i.e., higher soil P concentrations nearer the soil surface rather than mixed throughout the plow layer). The recent increase of P in the Great Lakes has been attributed to the increased loss of water-soluble P from no-till systems and has led some to claim that no-till should not be considered a best management practice. However, many no-till farmers in Ontario are not 100% no-till but rather use some tillage within their rotation, usually before the planting of corn. Moreover, most published work in Ontario does not report on annual P losses but rather misses late-fall to early spring flow events. The potential impact of the one-in-three-year tillage on P stratification in soil and losses of P in runoff waters has not been evaluated, particularly in terms of annual P loss under Ontario conditions.
The proposed research is a continuation of a project initiated in 2010 to examine the impact of tillage systems on annual P losses in runoff through tile lines. This study evaluates no-till, rotational tillage, and an annual tillage system, under a corn-soybean-wheat rotation. A unique aspect of the study is the fact that tile flow has been monitored throughout the entire year, with information on flow, soluble, and total P recorded. The results to date indicate that dissolved P concentrations in tile water do not appear to be affected by tillage practices at the sites. More data collected over a longer time period is needed to confirm this, particularly given the anomalous climatic conditions that occurred in 2012. This finding contrasts with what has been observed by researchers in other regions and has significant implications for the management of farms in Ontario if tillage is suggested as a means of decreasing soluble P losses.
Results:
1. Climatological and hydrological conditions over the study period:
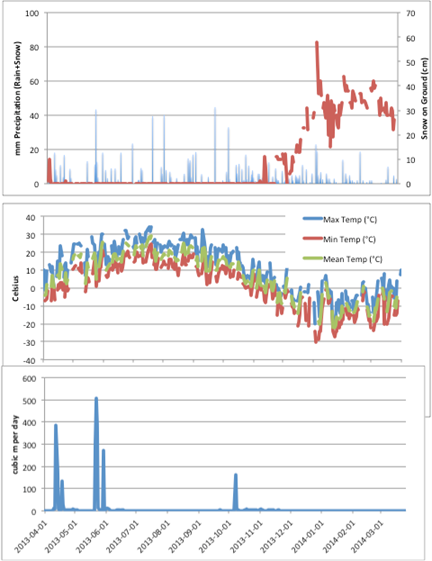
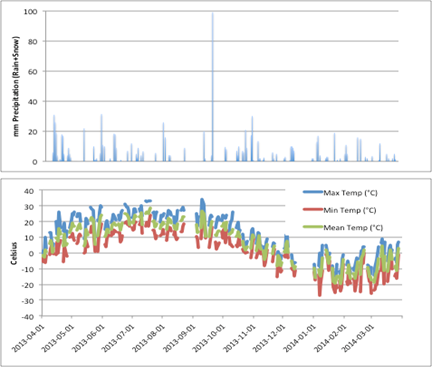
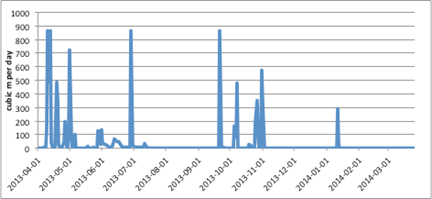
Meteorological data for one of the Innisfil sites (Site 1) and St. Marys are shown in Figures 1 and 2, respectively, for the period between April 2013 and March 2014. 2013 was an exceptionally wet year relative to 2012 (a major drought), which provided an opportunity to contrast among different water years. Rainfall was observed consistently throughout the 2013 spring, summer, and autumn months, leading to greater runoff losses in drainage tiles relative to 2011 and 2012. Tiles flowed longer into the summer in 2013 than they had in previous years due to the wet spring. However, despite the regular occurrence of rainfall throughout the summer of 2013, much of these losses in drainage tiles were as “baseflow” (long and steady flow) rather than substantial runoff “peaks”, such as those observed in the spring and autumn months. Thus, the strong seasonal trend shown by tiles (dominant flows observed in spring and autumn but not summer) has persisted across the entire study period despite large differences in rainfall distributions and magnitude. A very large rain event in St. Marys in September 2013 triggered a large runoff peak in September and additional runoff peaks during subsequent events that autumn due to wet antecedent moisture conditions. This was not observed at the Innisfil sites. In general, the autumn of 2013 and winter of 2014 were very cold, and tile drainage stopped in the late fall and did not flow again until after the current study period had ended, with one exception in January 2014 during a brief thaw. This is unusual for what has been observed in these regions over the past decade and is more typical of what was observed more than 30 years ago.
Figure 1: Meteorological data and tile flow at the Innisfil 1 site for the study period, April 2013-March 2014.

Figure 2: Meteorological data and tile flow at the St. Marys site for the study period, April 2013-March 2014.


2. Comparison of tile drainage and P concentrations collected between August 2012-March 2014 to 2011-2012 at each of the 3 sites (3 plots/site):
Although the study period was between April 2013 – March 2014, we have included additional data (dissolved reactive P concentrations) collected from August 2012 – March 2014 to better demonstrate our findings as this includes the period following manure application at the St. Marys site. The inclusion of these data also offsets the fact that there were no samples collected for the last four months of the study period because of the very cold winter in early 2014.
As has been observed in the past, elevated dissolved reactive and total P concentrations were observed during periods of high runoff (i.e., peak flow). This was consistent across the entire study period at all sites. Dissolved reactive P (and total P) concentrations were typically at or below the detection limit (<0.001 mg/L) during baseflow. The dissolved reactive fraction of P dominated in winter events whereas particulate P dominated when rain events occurred on bare/thawed fields. This was consistent across the sites and is consistent with what has been observed at other sites across Ontario.
Dissolved reactive P concentrations are summarized (Median, Minimum-Maximum) for two periods: (1) Feb 2011 – July 2012; and (2) August 2012 – March 2014 (although flow stopped in autumn 2013 and the data does not include the snowmelt 2014 period which occurred in April 2014). This division of the two periods is important at the various sites for different reasons. At Innisfil 1 and 2, the plots were all reduced till (RT) or no-till (NT), and no tillage had been done. At St. Marys, although the tillage treatments were in place (disk till (DT), RT, NT), P fertilizer had been applied in bands. For the second period (August 2012 – March 2014), tillage was done on the Innisfil plots (although they still received banded P fertilizer), and manure (liquid poultry) was applied at the St. Mary’s site.
| Site | Feb ’11 – Jul ’12 DRP (mg/L) | Aug ’12 – Mar ’14 DRP (mg/L) | ||
| Innisfil 1 | RT(F) | 0.005 (<0.001 – 0.116) | DT(F) | 0.011 (<0.001 – 0.105) |
| RT(F) | 0.001 (<0.001 – 0.166) | RT(F) | 0.003 (<0.001 – 0.227) | |
| NT(F) | 0.002 (<0.001 – 0.018) | NT(F) | 0.001 (<0.001 – 0.020) | |
| Innisfil 2 | RT(F) | 0.001 (<0.001 – 0.717) | DT(F) | 0.003 (<0.001 – 0.025) |
| RT(F) | 0.001 (<0.001 – 0.043) | RT(F) | 0.003 (<0.001 – 0.020) | |
| NT(F) | 0.001 (<0.001 – 0.242) | NT(F) | 0.003 (<0.001 – 0.007) | |
| St Marys | DT(F) | 0.001 (<0.001 – 0.033) | DT(M) | 0.014 ( 0.002 – 0.102) |
| RT(F) | 0.008 (<0.001 – 0.125) | RT(M) | 0.029 ( 0.003 – 1.242) | |
| NT(F) | 0.002 (<0.001 – 0.041) | NT(M) | 0.011 (<0.001 – 0.272) |
Table 1:Median (Min-Max) dissolved phosphorus concentrations (mg/L) for disk till (DT), no-till (NT) or reduced till (RT) plots receiving inorganic fertilizer in bands (F) or liquid poultry manure via surface broadcast (M).
It appears that medians are largely the same for the earlier period, across both plots and sites. Tillage did not appear to have a substantial effect on dissolved reactive P concentrations across the plots at the St. Marys site or at Innisfil Field 2. However, dissolved reactive P concentrations were greater for the tilled plot in the Innisfil 1 field (see Aug 2012-Mar 2014 in Table 1). This may be in part due to the fact that this field is on a hillslope and the DT does not receive as much baseflow as the RT or NT plots and thus only receives “event” flow. Indeed, the maximum dissolved reactive P concentrations observed were similar across the plots. There was no effect of tillage seen at Innisfil Field 2, which does not have the confounding effect of topography.
Median concentrations were much greater at the St. Marys site following manure application. Some very high P concentrations were observed during exceptionally wet periods (e.g., March, April 2013, September 2013). Moreover, the RT or NT plots appear to have had greater dissolved reactive P concentrations than the DT plot during these periods of peak flow at the St. Mary’s site. This is likely because of broadcasting of manure at this site, and the very wet conditions in 2013. These differences among the tillage plots were not observed prior to the application of manure. Unfortunately, a small number of events at a single site do not provide enough data to draw conclusions, but these events have provided enough insight to seek funds to investigate this further. The co-operator has agreed to apply manure again this autumn for investigation.
3. Experimental work on tillage and fertilizer application:
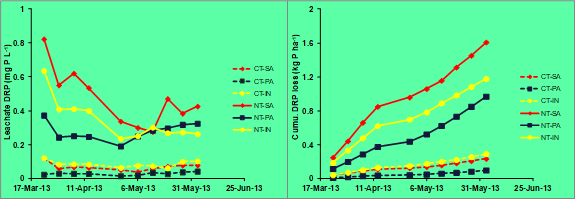
As noted previously, concerns regarding no-till production are that P accumulates at the soil surface, thereby enriching the dissolved P concentration in waters flowing over the field and increasing the risk of preferential flow through the soil to tile lines due to the presence of an intact, continuous macropore system from the surface to drainage tiles. Surface broadcasting of P containing materials (such as manures or P fertilizers) would presumably experience similar potential through soil movement if the macorpore system in no-till soils is left intact. Using intact soil cores from the Innisfil site we assessed the impact of soil disturbance and fertilizer incorporation on P loss in 10 successive leaching events. The treatments consisted of soil disturbance (to simulate intensive tillage (DT) and undisturbed (to simulate no-till (NT)). Within each of these tillage “systems” we either left the soil undisturbed (SA) or disturbed the top 5 cm of the soil column (to simulate a shallow disking) before or after applying 110 kg P/ha (as MAP). This ‘disking’ treatment was to either break preferential flow paths prior to fertilizer application (PA) or to incorporate (IN) the P fertilizer. Some European studies have shown greater benefit to incorporation of the fertilizer than simply the disturbance of macropore flow.
Although the two soils had similar soil test P levels (21 ppm) in the top 15 cm, the application of P fertilizer to the no-till soil (average 0.364 mg/L) resulted in greater P concentrations and losses than that seen from the DT soil (average 0.06 mg P/L) (Figure 3). It should be noted that these concentrations are considerably higher than the 0.03 mg P/L surface water quality objectives. The results indicate that there was little impact of the “disking” treatment on P leaching through an extensively disturbed (i.e., simulated DT) soil although disturbing the soil prior to fertilizer application gave lower cumulative leaching losses. A similar trend was observed for the NT soil, and although the treatment differences were larger, the data was more variable and so the only significant difference in cumulative P leaching was between the SA and PA treatments. Total P losses in leaching water followed similar trends with the notable exception that the “disking’ treatment resulted in total P losses similar to those observed in the NT soils. Thus, soil disturbance prior to a leaching event may encourage the loss of particulate P. When looking at the proportion of total P leached as dissolved P, NT soils had a significantly greater proportion of the P leached as dissolved P (67% NT vs 22% DT), and the SA treatment (81% NT and 38% DT) was greater than disturbing the soil just before application (56% NT and 11% DT).
These preliminary results would suggest that NT is at a higher risk for P loss when P fertilizer is applied, while most of our field data to date has simply been examining the losses of P under situations with no or very little P applied. Thus, the potential risk of P loss through leaching may be more significantly impacted by fertilization practice than inherent soil test levels. Shallow disking of the soil prior to P application will reduce P losses from NT systems, but the losses still appear to be greater than those from a soil that has far greater disturbance. One should also realize that the concentrations of P in leachate water observed in this experiment are for soil water exiting the top 25-30 cm of soil. One might expect some attenuation of these P levels as water moves through the subsoil to the tile lines, although this again would depend upon the soil properties and proportion of preferential vs matrix flow that is occurring.
These experimental results are in agreement with what has been observed in the field at the St. Marys site August 2012-March 2014.
Figure 3: Leachate dissolve reactive P (DRP) concentration and cumulative loss after 10 leaching events as affected by tillage and application treatments.

External Funding Partners:
Agricultural Adaption Council – Canadian Agricultural Adaptation Program
Project Related Publications:
None.

